Semantic Web Data Visualization with Graph Style Sheets
Résumé
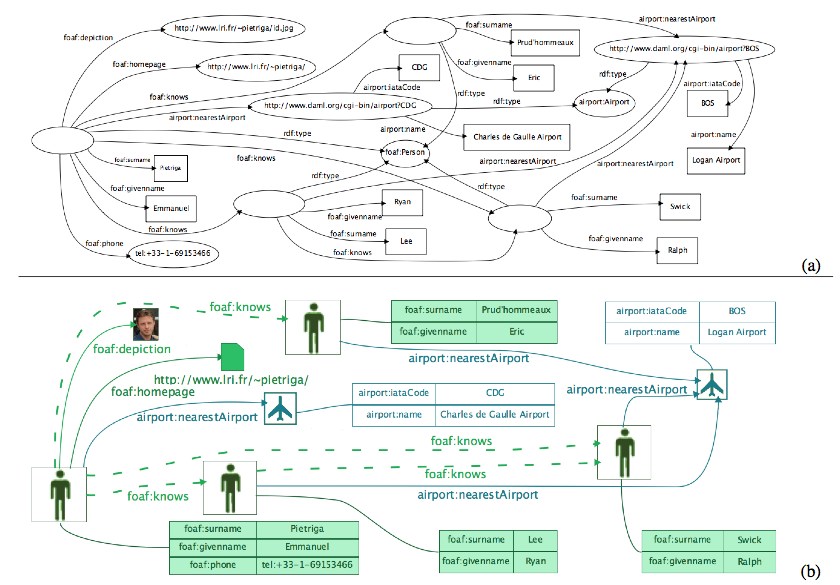
Visual paradigms such as node-link diagrams are well suited to the representation of Semantic Web data encoded with the Resource Description Framework (RDF), whose data model can be seen as a directed labeled graph. However, these representations are not fully satisfying: diagrams can quickly become big and over-cluttered, making them hard to understand. This problem can be partly ad- dressed by visually transforming the graphs: filtering information, providing alternative layouts for specific elements, and using all available visual variables to encode information, so as to better take advantage of human perceptual abilities. Graph Style Sheets have been designed for that purpose, allowing the filtering, grouping and styling of information elemative transformation rules.
Fichier principal
 softvis2006.pdf (166.07 Ko)
Télécharger le fichier
softvis2006.pdf (166.07 Ko)
Télécharger le fichier
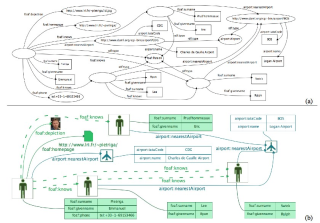 fig1.jpg (119.76 Ko)
Télécharger le fichier
fig1.jpg (119.76 Ko)
Télécharger le fichier
Origine : Fichiers produits par l'(les) auteur(s)
Format : Figure, Image
Loading...